
Capital Budgeting: Process, Methods, and Problems
Capital Budgeting: Process, Methods, and Problems
This document explains the capital budgeting process, traditional and modern project appraisal methods, and provides practical examples with solutions.
Capital Budgeting Process (4 Steps)
The capital budgeting process involves several steps to ensure informed investment decisions:
-
Idea Generation: This is the brainstorming phase. Where do potential projects come from? From anywhere! New product ideas, efficiency improvements, regulatory requirements, etc. The important thing is to collect a pool of ideas.
- Example: A company might consider launching a new product, expanding into a new market, or upgrading its existing equipment.
-
Project Evaluation: This step involves analyzing and screening potential projects based on their estimated profitability, risk, and alignment with the company's strategic goals.
- Financial Analysis: Use the methods we'll discuss below (Payback, NPV, IRR, etc.) to crunch the numbers.
- Strategic Fit: Does the project align with the company's long-term vision?
- Risk Assessment: How likely is the project to succeed? What are the potential downsides?
-
Project Selection: Based on the evaluation, the company selects the projects that offer the best potential returns and align with its objectives. This may involve ranking projects and choosing the top contenders, given the available budget.
- Prioritization: Some projects are "must-do" (e.g., legally required safety upgrades). Others compete for limited resources.
- Budgeting: Making sure there's enough capital to fund the selected projects.
-
Implementation and Monitoring: Once a project is selected, it is implemented, and its performance is continuously monitored to ensure that it meets the expected outcomes. This includes tracking costs, revenues, and other key performance indicators.
- Execution: Putting the plan into action.
- Performance Tracking: Are things going as planned?
- Corrective Action: If there are problems, take steps to fix them.
Project Appraisal Methods
We can broadly classify project appraisal methods into two categories: Traditional (Non-Discounted Cash Flow) and Modern (Discounted Cash Flow).
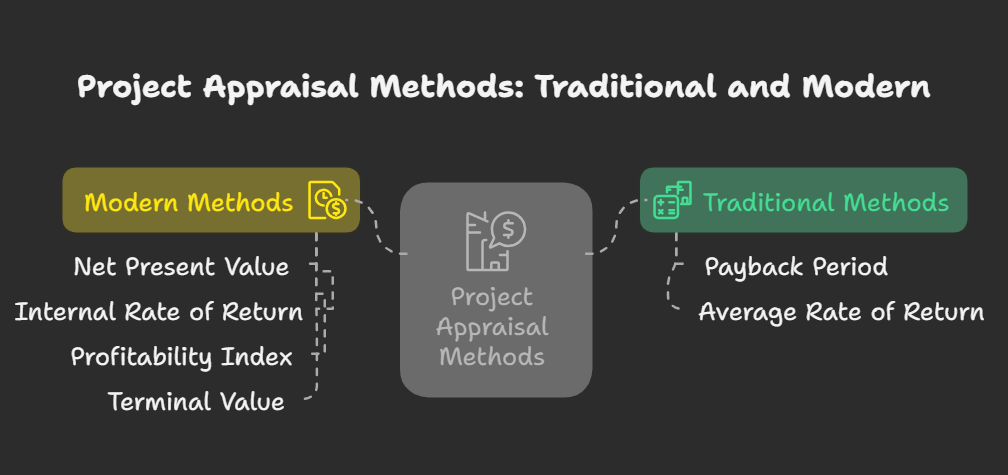
1. Traditional (Non-Discounted) Methods
These methods are simpler to calculate but don't account for the time value of money.
a) Payback Period (PBP)
-
What it is: The time it takes for a project's cash inflows to equal the initial investment (cost). How long until you "get your money back?"
-
Formula:
Payback Period = Initial Investment / Annual Cash Inflow(If the cash flows are uniform)- If cash flows are uneven, calculate the cumulative cash flow year by year until it equals the initial investment. Then interpolate for the fraction of the year.
-
Example: A project costs ₹100,000 and generates annual cash inflows of ₹25,000.
-
Payback Period = ₹100,000 / ₹25,000 = 4 years
-
-
Question: A project costs ₹50,000 and generates the following cash inflows: Year 1: ₹10,000, Year 2: ₹15,000, Year 3: ₹20,000, Year 4: ₹15,000. What is the payback period?
- Year 1: Cumulative Cash Flow = ₹10,000
- Year 2: Cumulative Cash Flow = ₹10,000 + ₹15,000 = ₹25,000
- Year 3: Cumulative Cash Flow = ₹25,000 + ₹20,000 = ₹45,000
- We need ₹5,000 more (₹50,000 - ₹45,000)
- In Year 4, we have ₹15,000, so we only need a fraction of it.
- Payback = 3 + (₹5,000 / ₹15,000) = 3 + 0.33 = 3.33 years
-
Advantages:
- Simple to understand and calculate.
- Easy to use in evaluating investments
- Focuses on quick recovery of investment.
-
Disadvantages:
- Ignores the time value of money.
- Ignores cash flows after the payback period.
- May lead to the rejection of profitable projects that have a longer payback period.
- Does not provide an objective criterion for decision-making
- Not suitable for long-term investment decisions
b) Average Rate of Return (ARR) / Accounting Rate of Return
-
What it is: The average annual profit as a percentage of the average investment. What's the average return on your investment, according to accounting numbers?
-
Formula:
ARR = (Average Annual Profit / Average Investment) * 100- Average Investment = (Initial Investment + Salvage Value) / 2 (If no salvage value, Average Investment = Initial Investment/2)
-
Example: A project costs ₹50,000. The estimated profits after depreciation and taxes are: Year 1: ₹8,000, Year 2: ₹10,000, Year 3: ₹12,000, Year 4: ₹10,000.
- Average Annual Profit = (₹8,000 + ₹10,000 + ₹12,000 + ₹10,000) / 4 = ₹10,000
- Average Investment = ₹50,000 / 2 = ₹25,000 (Assuming no salvage value)
-
ARR = (₹10,000 / ₹25,000) * 100 = 40%
-
Question: A project costs ₹80,000 with a salvage value of ₹10,000. The estimated profits after depreciation and taxes are: Year 1: ₹12,000, Year 2: ₹15,000, Year 3: ₹18,000. Calculate the ARR.
- Average Annual Profit = (₹12,000 + ₹15,000 + ₹18,000) / 3 = ₹15,000
- Average Investment = (₹80,000 + ₹10,000) / 2 = ₹45,000
- ARR = (₹15,000 / ₹45,000) * 100 = 33.33%
-
Advantages:
- Simple to calculate and understand.
- Uses accounting data which is readily available.
-
Disadvantages:
- Ignores the time value of money.
- Based on accounting profits, which can be manipulated.
- Does not consider the reinvestment potential of cash flows.
- May not be consistent with the goal of maximizing shareholder wealth.
2. Modern (Discounted) Methods
These methods consider the time value of money, making them more reliable for long-term investment decisions.
a) Net Present Value (NPV)
-
What it is: The present value of all future cash flows (inflows minus outflows) of a project, discounted at a specific rate (the cost of capital).
- A positive NPV means the project is expected to add value to the company.
- A negative NPV means the project is expected to lose value.
-
Example: A project costs ₹50,000 and generates the following cash inflows: Year 1: ₹15,000, Year 2: ₹20,000, Year 3: ₹25,000. The discount rate is 10%.
- Year 1: ₹15,000 / (1.10)^1 = ₹13,636.36
- Year 2: ₹20,000 / (1.10)^2 = ₹16,528.93
- Year 3: ₹25,000 / (1.10)^3 = ₹18,782.87
- NPV = ₹13,636.36 + ₹16,528.93 + ₹18,782.87 - ₹50,000 = ₹-1,051.84
Since the NPV is negative, the project is not acceptable.
-
Question: A project requires an initial investment of ₹100,000. It is expected to generate cash inflows of ₹30,000 per year for 5 years. The company's cost of capital is 12%. Calculate the NPV and decide whether to accept the project.
- Year 1: ₹30,000 / (1.12)^1 = ₹26,785.71
- Year 2: ₹30,000 / (1.12)^2 = ₹23,915.82
- Year 3: ₹30,000 / (1.12)^3 = ₹21,353.41
- Year 4: ₹30,000 / (1.12)^4 = ₹19,065.54
- Year 5: ₹30,000 / (1.12)^5 = ₹17,022.81
- NPV = ₹26,785.71 + ₹23,915.82 + ₹21,353.41 + ₹19,065.54 + ₹17,022.81 - ₹100,000 = ₹8,143.29
Since the NPV is positive, the project is acceptable.
-
Decision Rule:
- NPV > 0: Accept the project.
- NPV < 0: Reject the project.
- NPV = 0: Indifferent (the project breaks even).
-
Advantages:
- Considers the time value of money.
- Provides a clear indication of whether a project will increase shareholder wealth.
-
Disadvantages:
- Can be difficult to calculate, especially with uneven cash flows.
- Requires an estimate of the discount rate, which can be subjective.
- Difficult to compare projects of different scales.
b) Internal Rate of Return (IRR)
-
What it is: The discount rate that makes the NPV of a project equal to zero. In other words, it's the rate of return that the project is expected to generate.
- If the IRR is higher than the cost of capital, the project is generally considered acceptable.
- If the IRR is lower than the cost of capital, the project should be rejected.
-
Formula: There's no direct formula. You usually solve for the IRR using trial and error, financial calculators, or spreadsheet software. The IRR is the 'r' that solves this equation:
0 = Σ [CFt / (1 + r)^t] - Initial Investment -
Example: A project costs ₹20,000 and is expected to generate a uniform cash inflow of ₹5,000 per year for 6 years. We need to find the IRR. Using a financial calculator or spreadsheet, we find the IRR to be approximately 9.7%.
- To approximate IRR without a calculator, you can use interpolation. Let's say at 8% NPV is positive and at 10% NPV is negative. The IRR would be somewhere between 8% and 10%.
-
Question: A project requires an initial investment of ₹40,000 and generates cash inflows of ₹12,000 per year for 5 years. The company's cost of capital is 10%. Calculate the IRR. (Use a financial calculator or spreadsheet software).
- Using a financial calculator or spreadsheet software, the IRR is approximately 12.8%.
-
Decision Rule:
- IRR > Cost of Capital: Accept the project.
- IRR < Cost of Capital: Reject the project.
- IRR = Cost of Capital: Indifferent.
-
Advantages:
- Considers the time value of money.
- Provides a rate of return figure, which is easy to understand.
-
Disadvantages:
- Can be difficult to calculate.
- May result in multiple IRRs for projects with unconventional cash flows.
- May lead to incorrect decisions when comparing mutually exclusive projects (projects where you can only choose one). NPV is generally preferred for this scenario.
c) Profitability Index (PI) / Benefit-Cost Ratio
-
What it is: The ratio of the present value of future cash inflows to the initial investment. It measures the value created per rupee invested.
-
Formula:
PI = Present Value of Future Cash Inflows / Initial Investment -
Example: A project costs ₹100,000, and the present value of its future cash inflows is ₹120,000.
-
PI = ₹120,000 / ₹100,000 = 1.2
-
-
Question: A project requires an initial investment of ₹50,000. The expected cash inflows over the project's life, discounted at the company's cost of capital, have a present value of ₹60,000. Calculate the profitability index.
-
PI = ₹60,000 / ₹50,000 = 1.2
-
-
Decision Rule:
- PI > 1: Accept the project.
- PI < 1: Reject the project.
- PI = 1: Indifferent.
-
Advantages:
- Considers the time value of money.
- Useful for ranking projects when capital is limited (capital rationing).
-
Disadvantages:
- May not always lead to the same decision as NPV, especially when comparing mutually exclusive projects.
d) Terminal Value
-
What it is: The estimated value of an asset or project beyond the explicit forecast period (e.g., beyond 5 or 10 years). It represents the present value of all future cash flows that cannot be explicitly projected. It’s essentially the 'going concern' value.
-
Why it's important: Important in long-term capital budgeting decisions, especially when the project's cash flows are expected to continue indefinitely or have a long lifespan.
-
Formulas:
-
Gordon Growth Model (Constant Growth Perpetuity):
Terminal Value = CFt+1 / (r - g)Where:
- CFt+1 = Expected cash flow in the first year after the explicit forecast period
- r = Discount rate (cost of capital)
- g = Constant growth rate of cash flows beyond the forecast period. Note: g must be less than r for the formula to work!
-
Exit Multiple Approach:
Terminal Value = Last Year's Cash Flow * Exit MultipleWhere:
- Exit Multiple = typically based on industry averages (e.g., Price/Earnings ratio, Enterprise Value/EBITDA).
-
-
Example (Gordon Growth Model): A project is forecasted for 5 years. In Year 5, the expected cash flow is ₹20,000. After year 5, cash flows are expected to grow at a constant rate of 3% per year. The discount rate is 10%.
- CFt+1 (Year 6 cash flow) = ₹20,000 * (1 + 0.03) = ₹20,600
- Terminal Value = ₹20,600 / (0.10 - 0.03) = ₹20,600 / 0.07 = ₹294,285.71
-
Example (Exit Multiple): A project is forecasted for 5 years. In year 5, the EBITDA is ₹15,000. The industry average Enterprise Value/EBITDA multiple is 8x.
- Terminal Value = ₹15,000 * 8 = ₹120,000
-
Important Note: The terminal value needs to be discounted back to the present value when calculating the total NPV of the project.
-
Advantages: Considers value creation beyond the projection period.
-
Disadvantages: Can significantly impact project valuation, making results sensitive to chosen growth rates or multiples.
Summary Table
| Method | Considers Time Value of Money? | Easy to Calculate? | Main Advantage | Main Disadvantage |
|---|---|---|---|---|
| Payback Period | No | Yes | Simple to understand | Ignores time value of money, ignores cash flows after payback |
| Average Rate of Return | No | Yes | Uses readily available accounting data | Ignores time value of money, relies on accounting profits |
| Net Present Value | Yes | No | Directly measures value creation | Can be complex, requires accurate discount rate |
| Internal Rate of Return | Yes | No | Provides a rate of return figure | Can be difficult, multiple IRRs possible |
| Profitability Index | Yes | Medium | Useful for ranking projects under capital rationing | May conflict with NPV |
| Terminal Value | Yes | Medium | captures long-term project benefits. | Heavily relies on assumptions, sensitivity to parameters |