New Page
Introduction
- We started our discussion on fixed and variable costs and how they influence cost.
- Let's explore further into the behavior of costs.
Cost Items in a Cost Sheet
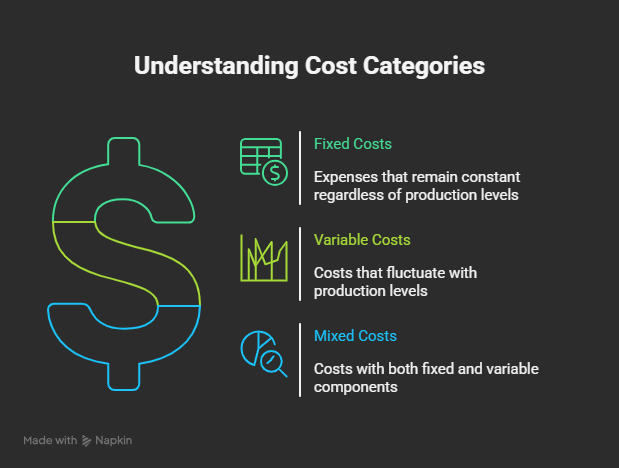
Material Cost (Variable Cost)
- Varies based on volume.
- No production → no material cost.
- If material cost = ₹100/unit:
- 1000 units → ₹1,00,000
- 2000 units → ₹2,00,000
- Employee wages based on units produced also considered variable.
Rent (Fixed Cost)
- Constant regardless of production.
- Examples: Depreciation, insurance, management salaries.
Repairs & Maintenance (Mixed Cost)
- Even with no production, basic maintenance required.
- More production → more maintenance cost.
Cost Classification Approaches
1. Accounting Analysis
- Manager manually classifies each item.
- Subjective, based on experience.
- Example: 30% of repairs = fixed, 70% = variable.
- Pros: Manager insight.
- Cons: Needs frequent review, may miss cost structure changes.
2. High-Low Method
- Based on highest and lowest activity level data.
- Assume linear relationship between cost and volume.
Example:
-- Lowest: 100 units → ₹50,000
-- Highest: 300 units → ₹1,20,000
-- ΔCost = ₹70,000; ΔVolume = 200
-- Variable Cost/Unit = ₹350 (₹70,000 / 200)
-- Fixed Cost = Total Cost - (Variable Cost × Units)
- For 100 units → ₹50,000 - ₹35,000 = ₹15,000
-- Pros: Simple, objective. -- Cons: Ignores other monthly data.
3. Scatter Graph Method
- Plot cost vs volume on XY chart (Excel).
- Y-axis: Total Cost
- X-axis: Volume
- Draw line through data points:
- Slope = Variable cost/unit
- Y-intercept = Fixed cost
4. Regression Analysis
- Uses all data points (e.g., 10 years of data).
- Equation:
Cost = a + b × Volume-
a= Fixed Cost -
b= Variable Cost (% of sales)
-
Real Company Example (10-Year Data)
Kansai Nerolac:
-
High-Low Method:
- Sales: ₹2731 lakh → Cost: ₹429 lakh
- Variable Cost: 14.28% of revenue
- Fixed Cost: ₹39.36 crore
-
Regression:
- Variable Cost: 14.76%
- Fixed Cost: ₹44.64 crore
ACC:
- Variable Cost: 23.57%
- Fixed Cost: ₹47 crore
Hindalco, Sterlite:
- Applied same methods.
Ultratech:
- Used 2004 data (2003 not available)
- Variable Cost: 22.46%
- Fixed Cost: ₹125 lakh
Asian Paints (Special Case):
- Revenue: ₹1650 → ₹8335 crore (5x increase)
- Cost: ₹280 → ₹1636 crore (>5x increase)
- Branding increased significantly → high variable component
- Negative fixed cost appears → indicates assumption flaw
Revised Regression (Intercept = 0):
- Equation:
S&D Cost = 0 + b × Sales - Variable Cost: 19.86%
- Fixed Cost: 0
- R² ~ 0.99: High reliability

