
Market Opportunity Navigator
Core Framework: The 2×2 Grid
Evaluates ideas based on Potential (economic/social impact) vs. Challenge (implementation difficulty).
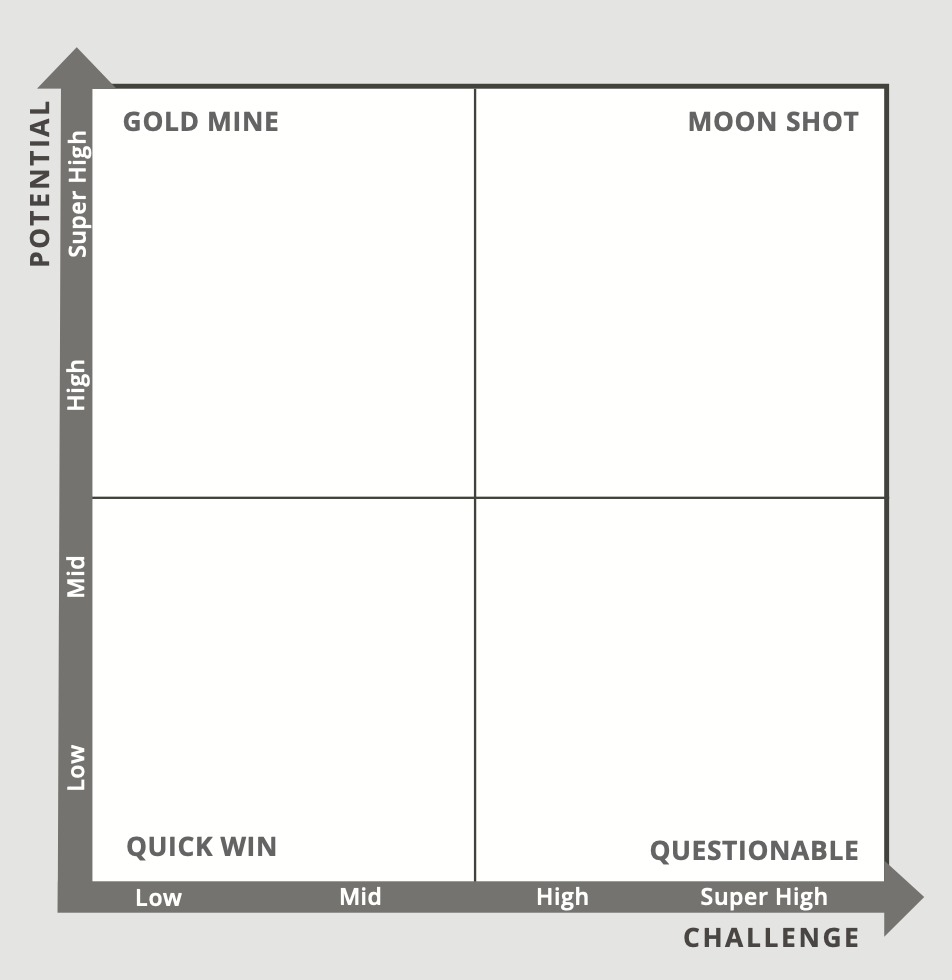
| Quadrant | Characteristics | Recommendation |
|---|---|---|
| Gold Mine | High Potential, Low Challenge | Pursue immediately (e.g., scalable SaaS). |
| Moonshot | High Potential, High Challenge | Pursue with caution; secure resources (e.g., deep-tech innovation). |
| Questionable | Low Potential, High Challenge | Re-evaluate timing/feasibility (e.g., niche product in saturated market). |
| Quick Win | Low Potential, Low Challenge | Low-risk but limited upside; easily replicated (e.g., simple app). |
Market Opportunity Attractiveness Evaluator
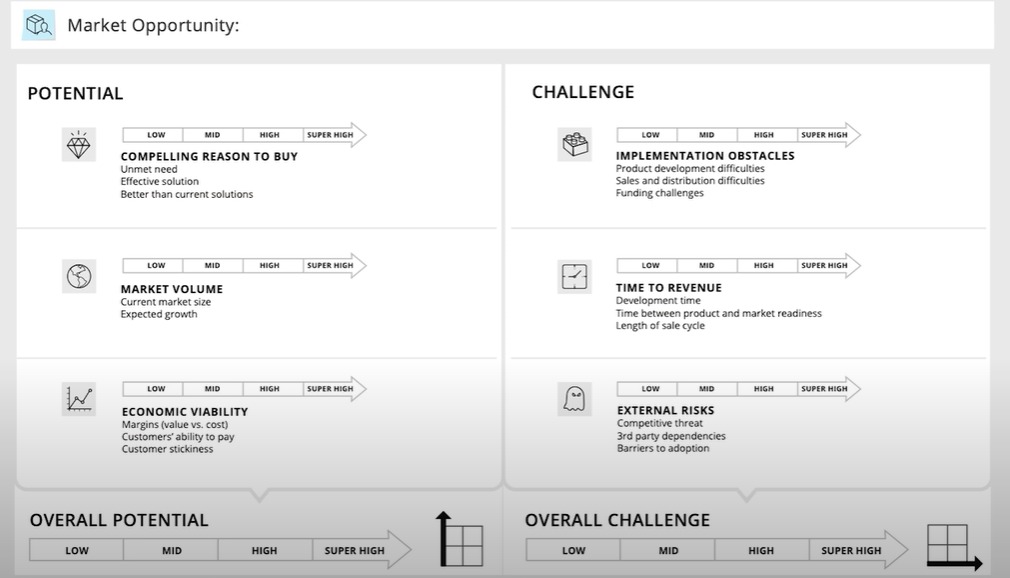
I. Evaluating Potential
Three dimensions with sub-factors (rated Low → Super High).
1. Compelling Reason to Buy
-
Unmet Need
- High rating: Severe unsolved problem (e.g., life-saving tech).
- Low rating: Well-served market (e.g., food delivery apps).
-
Effective Solution
- Does it deliver promised value?
- Example: AI diagnostics vs. manual processes.
- Does it deliver promised value?
-
Competitive Edge
- Unique advantage (e.g., cost, speed, quality).
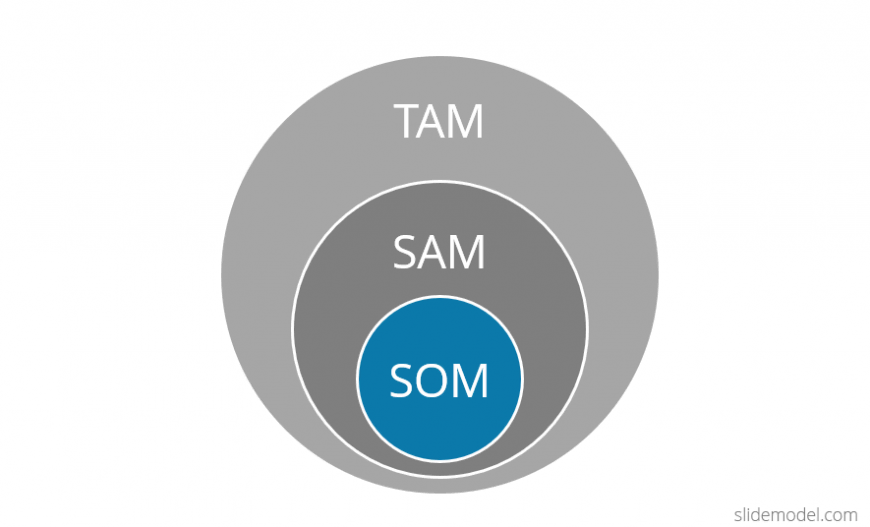
2. Market Volume
-
TAM (Total Addressable Market)
- Overall revenue opportunity (e.g., $5 B Indian EV market).
-
SAM (Serviceable Addressable Market)
- Target segment (e.g., $1 B for EV scooters within TAM).
-
SOM (Serviceable Obtainable Market)
- Realistic share considering competition (e.g., $200 M for a new EV scooter brand).
- Realistic share considering competition (e.g., $200 M for a new EV scooter brand).
-
Growth Rate
- CAGR (e.g., 15% for eco-friendly products).

Key Tip: Validate data via multiple sources (e.g., industry reports, GPT cross-checks).
3. Economic Viability
-
Margins
- Gross margin = (Revenue – COGS) / Revenue. Target > 40% for scalability.
-
Customer Ability to Pay
- Affordability vs. premium positioning (e.g., ₹2,300 smart bottle limits adoption in India).
-
Customer Stickiness
- Retention strategies (e.g., subscriptions, consumables, brand loyalty).
II. Evaluating Challenges
Rated Low → Super High (lower = better).
1. Implementation Obstacles
-
Product Development Difficulty
- Tech maturity, sourcing complexity, R&D timeline (e.g., nascent AI in EdTech).
-
Sales/Distribution Hurdles
- Brick-and-mortar vs. online (e.g., EV showrooms vs. D2C e-commerce).
2. Time to Revenue
-
Development Time
- Prototype → market readiness (e.g., biotech approvals take years).
-
Sales Cycle Length
- B2B: 6 – 12 months
- B2C: Immediate (e.g., Amazon listings)
3. External Risks
-
Competitive Threat
- Crowded markets = high risk (e.g., fitness apps with 50+ competitors).
-
Third-Party Dependencies
- Supply chain/regulatory risks (e.g., drone materials shortage).
-
Adoption Barriers
- Cultural resistance, pricing, complexity (e.g., smart bottles vs. ₹500 alternatives).
Case Study Insights
Ashana (Fitness Coaching Service)
- Mistake: Overestimated market volume by citing entire wellness industry (₹ 2.6 B) without segmenting for coaching.
- Economic Viability: Mid -rated due to subscription retention challenges.
- Feedback: Focus on service design to boost stickiness (e.g., personalized experiences).
Arithra (Eco-Friendly Smart Water Bottle)
- Market Volume: Rated high based on $60 M India market but corrected to mid – too small for VC funding.
- Economic Viability: Low margins (25 – 30%), high price barrier (₹2,300), low stickiness.
- External Risks: High competition and dependency on local manufacturers.
Key Takeaways & Best Practices
-
Bias Mitigation
- Entrepreneurs often overestimate potential. Use third-party evaluators for objectivity.
-
Revolutionary Ideas (e.g., SpaceX)
- Framework limitations: Market size unknown, challenges extremely high.
- Solution: Validate through action (prototypes, early adopters, co-founder buy-in).
-
Data Triangulation
- Cross-verify market numbers from ≥ 2 sources (e.g., reports + GPT + expert interviews).
-
Social Enterprises
- Adapt “Potential” to include social impact + financial sustainability.
-
Ultimate Validation
- Desk analysis is preliminary; real-world testing (e.g., MVP sales) is critical.
“The ultimate evaluation for any idea is action itself.”
No Comments