
Product Life Cycle
Product Life Cycle Strategies
Product Life Cycle (PLC) Strategy
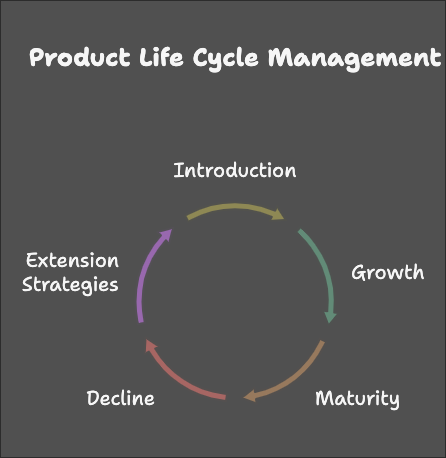
The Product Life Cycle (PLC) describes the stages a product goes through from its launch to its eventual decline in the market. Each stage requires different marketing, pricing, and product strategies.
Stages of the Product Life Cycle
1. Introduction Stage
- Definition: This is when the product is launched in the market. Sales are low, and the company invests heavily in promotion and distribution to create awareness.
-
Characteristics:
- High costs due to product development and marketing.
- Low or negative profits.
- Customers are early adopters and innovators.
-
Strategies:
- Promotion: Aggressively promote to build awareness (e.g., advertising, social media campaigns).
- Pricing: Use penetration pricing (low prices to gain market share) or skimming pricing (high prices to recover costs).
- Distribution: Focus on building distribution channels.
Example: Electric vehicles like Tesla's early models.
2. Growth Stage
- Definition: The product gains acceptance, sales increase rapidly, and profits improve.
-
Characteristics:
- Increasing demand and sales volume.
- Growing market share and profitability.
- Competitors may enter the market.
-
Strategies:
- Product Development: Enhance product features and quality.
- Market Expansion: Target new customer segments or geographic regions.
- Promotion: Shift focus from awareness to differentiation.
- Pricing: Consider competitive pricing to defend market share.
Example: Smartphones with advanced features entering the mainstream market.
3. Maturity Stage
- Definition: The market becomes saturated, and growth slows down. Profits peak and then stabilize or decline.
-
Characteristics:
- Intense competition and price wars.
- Customer demand stabilizes.
- Focus shifts to retaining customers.
-
Strategies:
- Differentiation: Add unique features to stand out.
- Promotions: Run loyalty programs, discounts, and bundling offers.
- Market Penetration: Attract competitors’ customers or non-users.
- Cost Management: Optimize production and distribution to maintain profitability.
Example: Carbonated soft drinks like Coca-Cola, which have been in the maturity stage for decades.
4. Decline Stage
- Definition: Sales and profits decline as customer interest fades due to new innovations or changes in consumer preferences.
-
Characteristics:
- Shrinking market size.
- Reduced profitability or losses.
- Obsolescence or market saturation.
-
Strategies:
- Product Updates: Relaunch or reposition the product if possible.
- Cost Control: Minimize costs by reducing marketing and distribution efforts.
- Harvest Strategy: Focus on profitability over sales by targeting niche markets.
- Exit Strategy: Discontinue or sell the product if it is no longer viable.
Example: DVD players replaced by streaming services.
Strategies to Extend the Product Life Cycle
To prevent products from reaching the decline stage, companies can adopt the following extension strategies:
-
Product Modification: Update or improve product features, design, or packaging.
- Example: Adding advanced features to smartphones, like foldable screens.
-
Rebranding or Repositioning: Change the way the product is perceived by targeting a new market or emphasizing different benefits.
- Example: Baking soda repositioned as a cleaning agent instead of just a baking ingredient.
-
Geographic Expansion: Enter new markets or regions.
- Example: Expanding sales of a product from domestic markets to international ones.
-
Promotional Efforts: Increase advertising, launch new campaigns, or offer discounts to reignite interest.
- Example: Limited-time offers or seasonal promotions.
-
Target New Segments: Identify and target untapped customer groups.
- Example: Marketing energy drinks to older adults as a health supplement.
-
Introduce Variants: Launch new variants, such as flavors, sizes, or special editions.
- Example: Coca-Cola introducing sugar-free or flavored versions of its drinks.
Importance of PLC Strategies
- Market Adaptation: Helps businesses adapt their strategies to the changing needs of the market.
- Resource Allocation: Guides investments in marketing, R&D, and production.
- Competitive Advantage: Enables firms to stay competitive by modifying their strategies based on the product's stage.
- Profit Maximization: Helps companies capitalize on high-demand phases and minimize losses during decline.
Visual Representation of the PLC
Here’s a basic outline of the product life cycle curve:
| Stage | Sales | Profits | Key Focus |
|---|---|---|---|
| Introduction | Low | Negative/Low | Awareness and adoption. |
| Growth | Rapid growth | Increasing | Market penetration. |
| Maturity | Peak sales | Peak profits | Customer retention. |
| Decline | Declining | Decreasing | Cost reduction or exit. |
By understanding the product life cycle and adopting appropriate strategies at each stage, businesses can optimize their product's performance, maximize profits, and extend its longevity in the market.
Strategic Tools
Ansoff's Matrix
Ansoff's Matrix
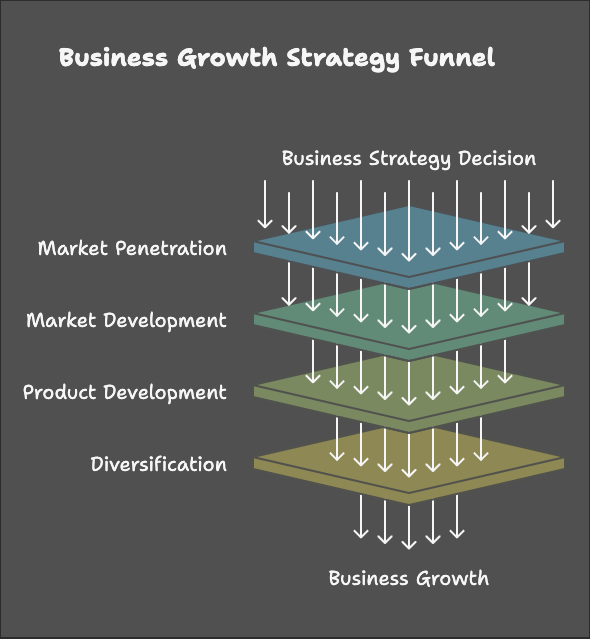
The Ansoff Matrix, also known as the Product/Market Expansion Grid, is a strategic planning tool that helps businesses identify growth opportunities by focusing on products and markets.
Four Growth Strategies in Ansoff’s Matrix
1. Market Penetration
- Definition: Selling more of the existing products to the current markets.
- Objective: Increase market share.
-
Strategies:
- Increase advertising and promotional efforts.
- Introduce loyalty programs or discounts.
- Improve distribution to increase product availability.
- Example: Coca-Cola encouraging increased consumption through discounts and marketing campaigns.
2. Market Development
- Definition: Selling existing products to new markets.
- Objective: Expand customer base by targeting new geographic regions or new customer segments.
-
Strategies:
- Expand into international markets.
- Target a different demographic or industry.
- Adapt existing products to suit new markets.
- Example: McDonald's entering new countries and adapting menus to local tastes.
3. Product Development
- Definition: Introducing new products to existing markets.
- Objective: Increase sales by meeting new customer needs.
-
Strategies:
- Invest in research and development (R&D).
- Add new features to current products.
- Develop complementary products.
- Example: Apple launching a new iPhone model to target its existing customer base.
4. Diversification
- Definition: Introducing new products to new markets.
- Objective: Enter completely new areas to spread risk and increase revenue.
-
Types of Diversification:
- Related Diversification: New products related to existing offerings (e.g., a car company launching electric vehicles).
- Unrelated Diversification: Entering an entirely different industry (e.g., a food company starting a financial services division).
- Example: Amazon moving from online retail to cloud computing (AWS).
| Strategy | Products | Markets | Risk Level |
|---|---|---|---|
| Market Penetration | Existing | Existing | Low |
| Market Development | Existing | New | Moderate |
| Product Development | New | Existing | Moderate |
| Diversification | New | New | High |
BCG Matrix (Boston Consulting Group Matrix)
The BCG Matrix is a portfolio management tool that helps businesses evaluate the performance of their products or business units based on market growth rate and relative market share.
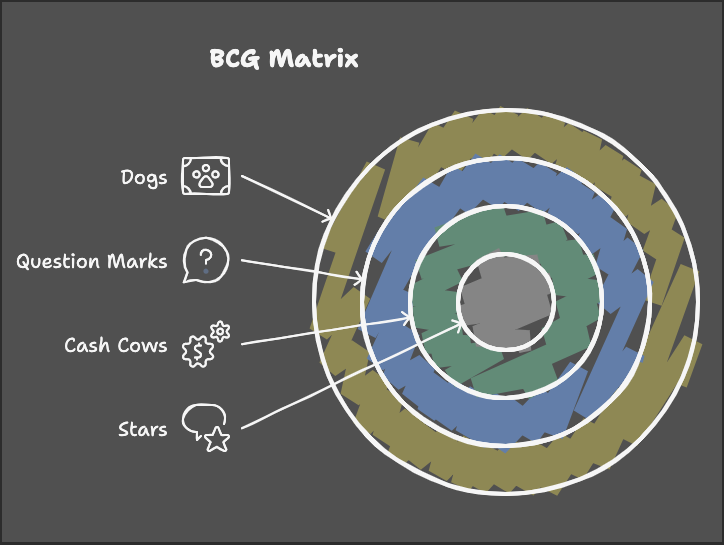
Components of the BCG Matrix
1. Stars
- Definition: Products or business units with high market growth and high market share.
-
Characteristics:
- Require significant investment to maintain growth.
- Have the potential to become cash cows.
-
Strategy:
- Invest to sustain growth and maintain leadership.
- Example: A fast-growing product like Tesla's electric vehicles in the EV market.
2. Cash Cows
- Definition: Products with low market growth but high market share.
-
Characteristics:
- Generate consistent cash flow with minimal investment.
- Often used to fund other ventures (e.g., Stars or Question Marks).
-
Strategy:
- Maintain and defend market share.
- Example: Coca-Cola’s flagship beverages in the soft drink market.
3. Question Marks
- Definition: Products with high market growth but low market share.
-
Characteristics:
- Have potential to become Stars but require significant investment.
- Risk of failure if not supported properly.
-
Strategy:
- Assess and invest in promising opportunities or divest if growth seems unlikely.
- Example: New startups or product lines in emerging markets.
4. Dogs
- Definition: Products with low market growth and low market share.
-
Characteristics:
- Generate little profit and often require significant resources.
- May be phased out or sold off.
-
Strategy:
- Harvest (minimize investment and maximize cash flow) or divest.
- Example: Outdated technologies like DVD players.
| Category | Market Growth | Market Share | Strategy |
|---|---|---|---|
| Stars | High | High | Invest and sustain growth. |
| Cash Cows | Low | High | Maximize cash flow and maintain. |
| Question Marks | High | Low | Invest selectively or divest. |
| Dogs | Low | Low | Harvest or phase out. |
Comparison of Ansoff Matrix and BCG Matrix
| Aspect | Ansoff Matrix | BCG Matrix |
|---|---|---|
| Purpose | Identifies growth opportunities. | Assesses product performance and profitability. |
| Focus | Product and market strategies. | Market growth and market share. |
| Scope | Forward-looking (strategy planning). | Current portfolio analysis. |
| Use Case | Developing growth plans. | Allocating resources to product lines. |
Conclusion
Both Ansoff’s Matrix and BCG Matrix are essential tools in strategic planning:
- Ansoff’s Matrix helps businesses explore growth opportunities.
- BCG Matrix helps allocate resources to products or business units effectively.
These tools are often used together to ensure a balanced approach to growth and profitability. Let me know if you need further elaboration! .
No Comments