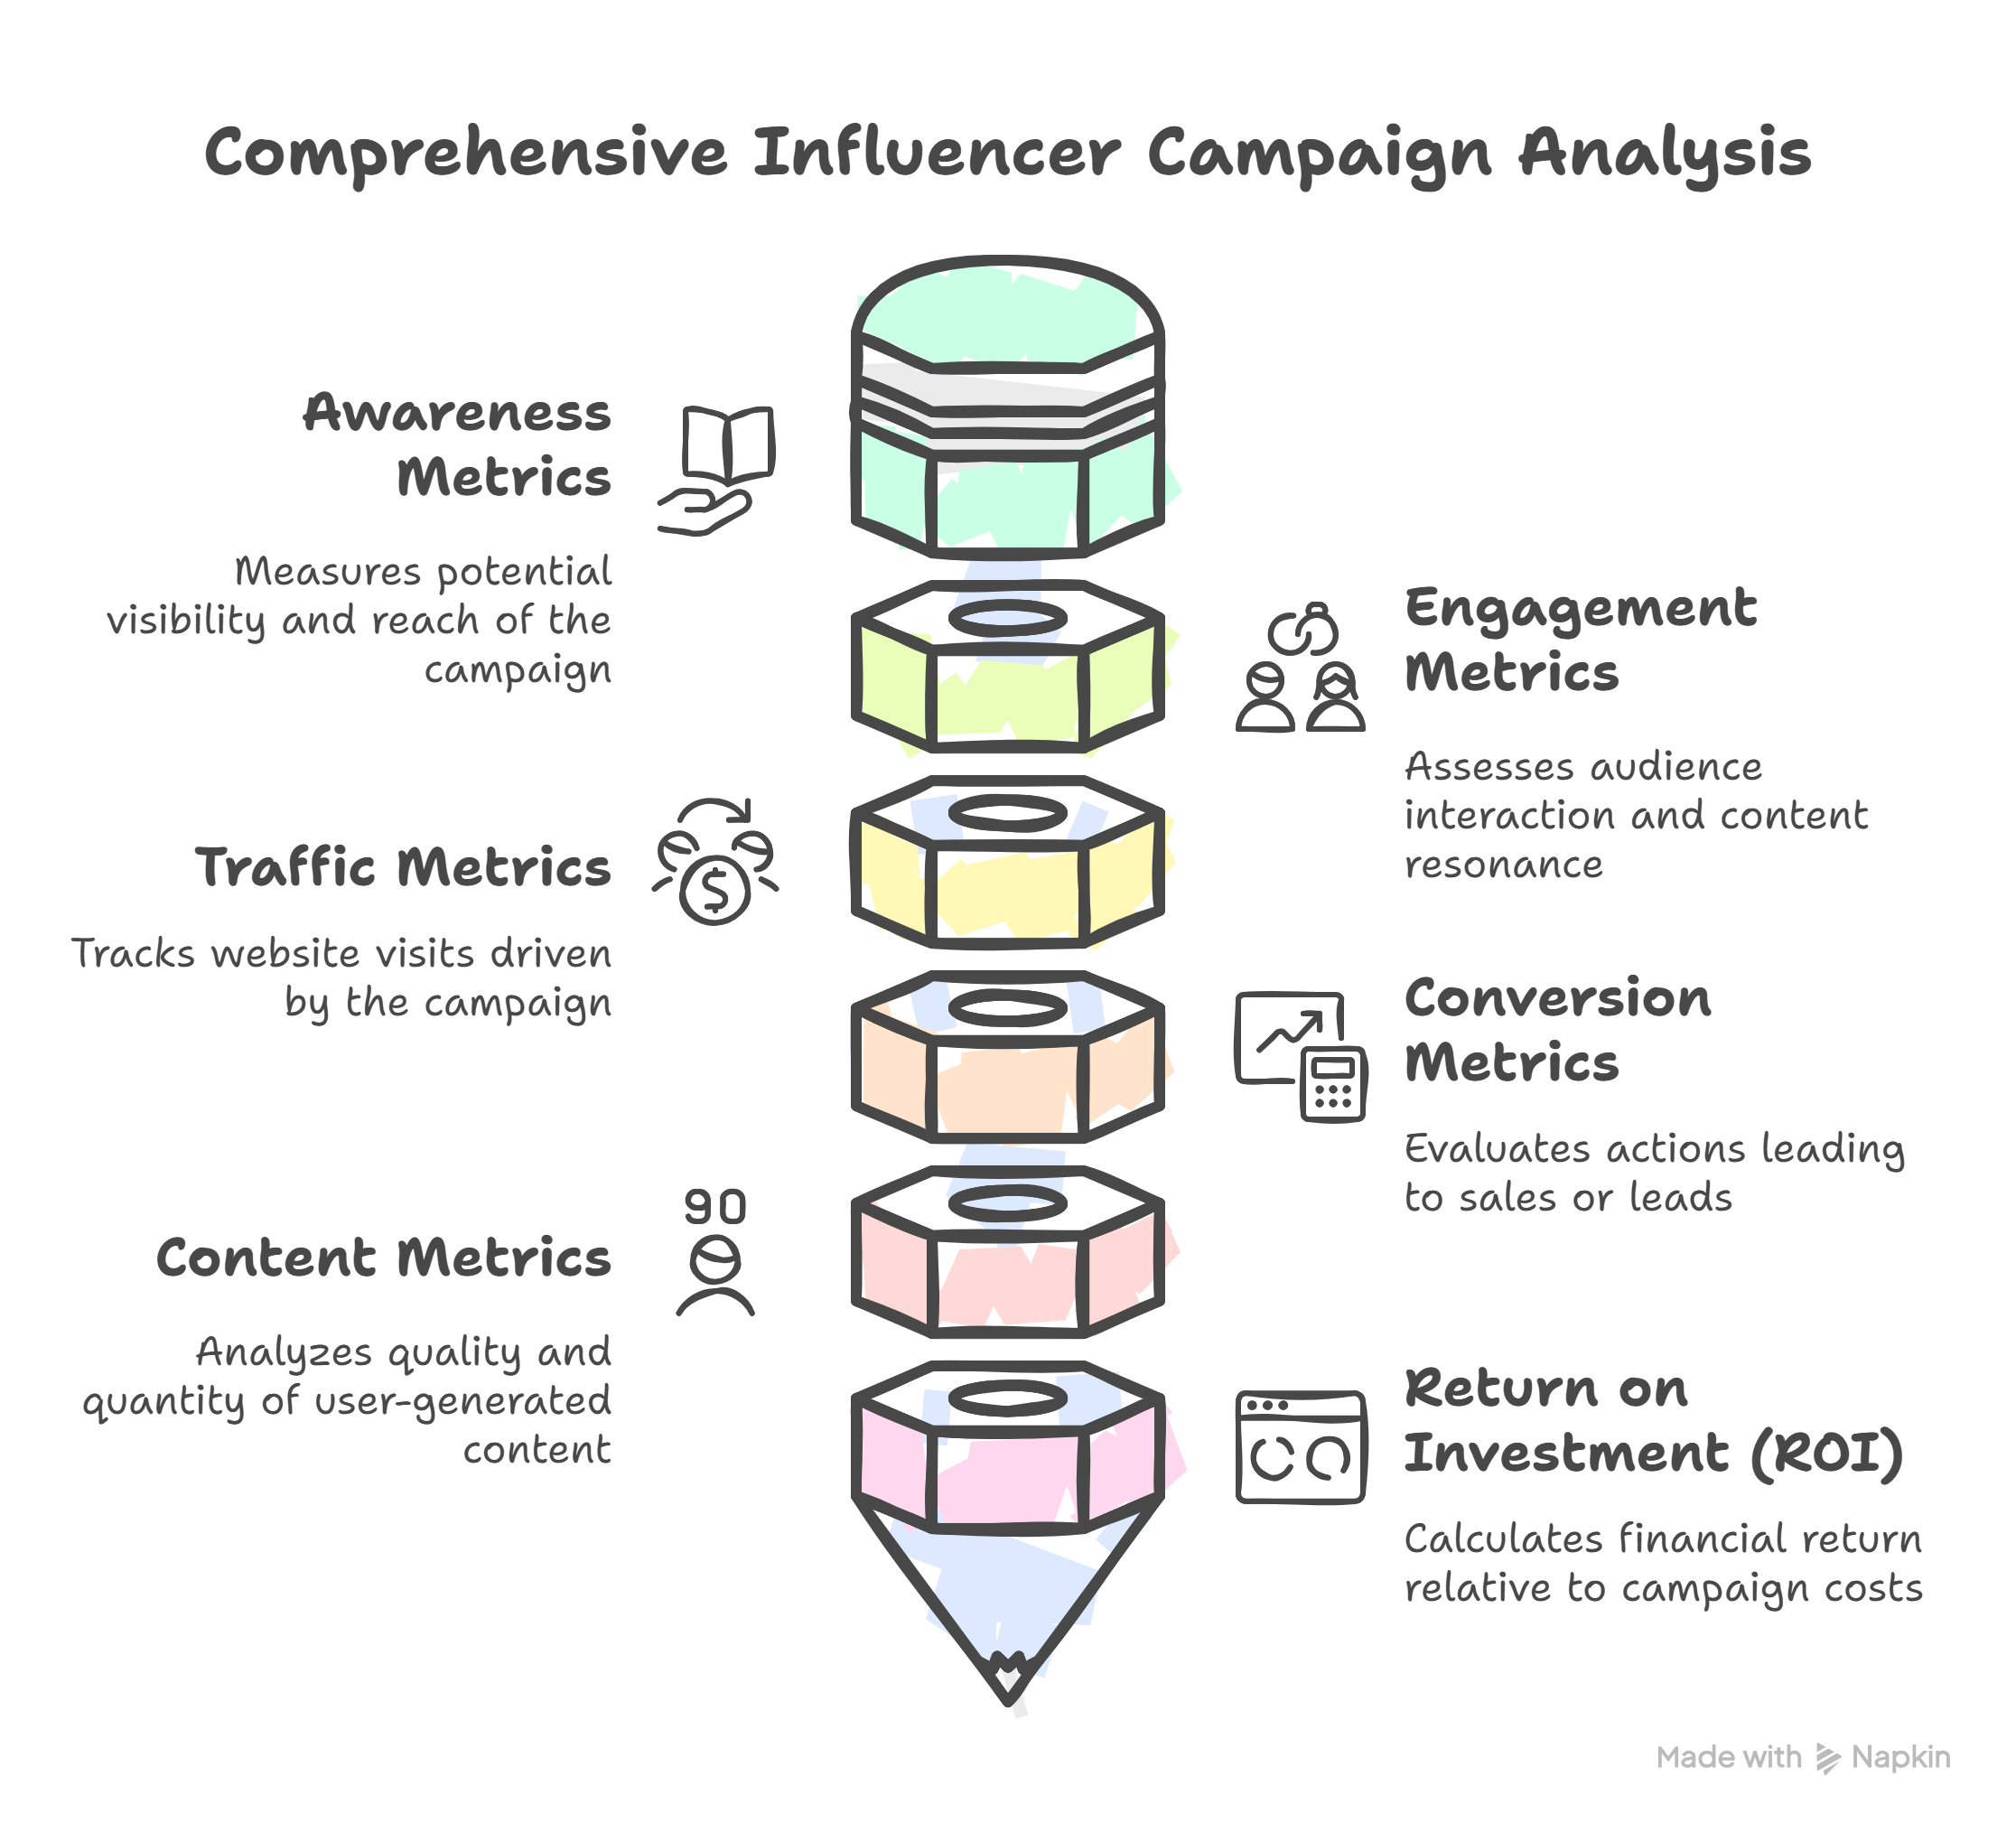
Measuring the Results of an Influencer Marketing Campaign (Metrics)
After executing an influencer campaign, measuring its performance is essential to understand its impact, justify the investment, and inform future strategies. You need to track specific metrics that align directly with the goals you set during the planning phase.
Here are key metrics categorized by common campaign objectives:
1. Awareness Metrics
- Goal: To understand how many people potentially saw the campaign content.
-
Metrics:
- Reach: The total number of unique accounts/people who saw the influencer's content.
- Impressions: The total number of times the influencer's content was displayed (one person could see it multiple times).
- Why it Matters: These metrics gauge the campaign's potential visibility and breadth.
- Relatable Example: If an influencer's post had a reach of 50,000, it means 50,000 different people saw it at least once. If it had 70,000 impressions, it means the content was viewed 70,000 times in total (some people likely saw it more than once).
2. Engagement Metrics
- Goal: To measure how the audience interacted with the content.
-
Metrics:
- Likes, Comments, Shares, Saves: Direct indicators of audience reaction and interaction.
- Clicks: Number of times users clicked on links within the post (e.g., link in bio, swipe-up story link).
- Engagement Rate: (Total Engagements / Reach or Impressions) x 100%. This shows the percentage of people who interacted with the post after seeing it.
- Why it Matters: High engagement suggests the content resonated well with the audience and wasn't just passively viewed.
- Relatable Example: A post with 1,000 likes, 100 comments, and 50 shares shows strong audience interaction. Calculating the engagement rate helps compare performance across influencers with different audience sizes.
3. Traffic Metrics
- Goal: To track how many people visited your website or landing page as a result of the campaign. This relates closely to web analytics concepts.
-
Metrics:
- Referral Traffic: Using tools like Google Analytics to see how many visitors came to your site directly from the influencer's link. (Using unique UTM parameters on links is crucial for accurate tracking).
- Click-Through Rate (CTR): (Total Clicks / Total Impressions) x 100%. The percentage of impressions that resulted in a click.
- Why it Matters: Measures the campaign's effectiveness in driving interest and action beyond the social media platform itself.
-
Relatable Example: Using a UTM link like
yourwebsite.com/?utm_source=instagram&utm_medium=influencer&utm_campaign=summer_promo&utm_content=influencer_Aallows Google Analytics to show exactly how many sessions were initiated via Influencer A's specific link for the summer promo campaign.
4. Conversion Metrics
- Goal: To measure valuable actions taken by the audience, often related to sales or lead generation. This directly links to measuring overall marketing effectiveness.
-
Metrics:
- Leads: Number of sign-ups, form submissions, or downloads generated.
- Sales: Number or value of purchases made. (Often tracked using unique discount codes or affiliate links assigned to the influencer).
- Conversion Rate: (Total Conversions / Total Clicks) x 100%. The percentage of clicks that resulted in a desired conversion.
- Why it Matters: These metrics directly tie the campaign to bottom-line business results like revenue or customer acquisition.
- Relatable Example: Assigning the code "INFLUENCER15" to a specific influencer lets you track exactly how many sales used that code at checkout, directly attributing revenue to their efforts.
5. Content Metrics
- Goal: To assess the amount and quality of content generated, especially if User-Generated Content (UGC) was an objective.
-
Metrics:
- Volume of UGC: Number of posts created by the audience using the campaign hashtag or mentioning the brand.
- Quality of UGC: Assessing the relevance and aesthetic quality of the user-generated content.
- Why it Matters: Measures brand engagement beyond simple likes/comments and provides authentic social proof and potentially reusable content.
- Relatable Example: A brand runs a contest asking users to share photos using their product with #MyBrandStyle. Tracking the number of posts using this hashtag shows the volume of UGC generated by the campaign.
6. Return on Investment (ROI)
- Goal: To determine the overall financial return of the campaign relative to its cost.
-
Calculation:
[(Value Generated - Campaign Cost) / Campaign Cost] x 100%- Value Generated could be direct revenue from sales, estimated value of leads, or even calculated media value based on reach/engagement.
- Campaign Cost includes influencer fees, product costs, tool subscriptions, ad spend for amplification, etc.
- Why it Matters: ROI is the ultimate measure of whether the campaign was a worthwhile financial investment for the business.
- Relatable Example: If a campaign cost $2,000 (influencer fee + product) and generated $5,000 in direct sales tracked via their code, the ROI is [($5,000 - $2,000) / $2,000] x 100% = 150%.
Reporting
- Concept: Compile all relevant tracked metrics into a clear report. Summarize performance against the initial goals and KPIs. Include insights and recommendations for future campaigns.
- Why it Matters: Reporting demonstrates accountability, showcases results to stakeholders, and provides valuable learnings for continuous improvement.
- Relatable Example: Creating a presentation or document showing the campaign goals, the results for each key metric (Reach: X, Engagement Rate: Y%, Sales: Z), the calculated ROI, and concluding with "The campaign successfully exceeded the sales goal by 20%, suggesting continued partnership with this influencer profile is recommended."


No Comments